
Development environment certified for all industry standards: DO-178, EN-50128, ISO-26262, IEC-62304
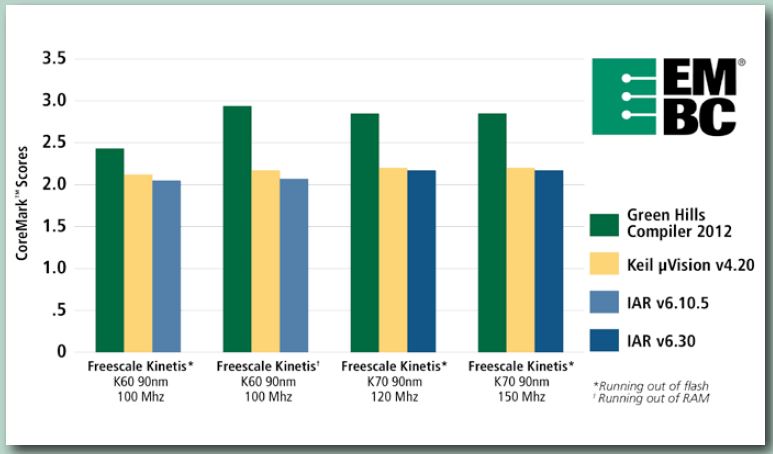
Compilers with the most optimized code generation on the market according to EEMBC benchmarks
Most powerful debugger on the market: multicore, mutitask and with debugging backwards used with the GH Probe
Integrated static code analyzer very fast by sharing functions with the compiler
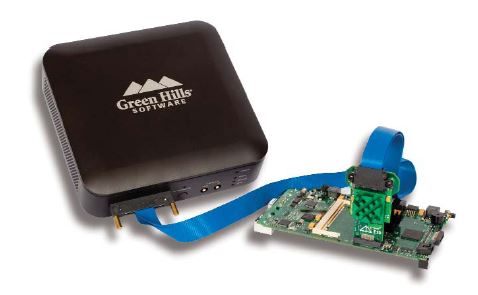
GH Probe debugging probe with 4Gb of hardware tracing
Supports more than 1000 processors and more than 300 manufacturers
Green Hills provides a qualification package for code generation tools for:
IEC 61508
ISO 26262
DO-178B | ED-12B
CENELEC | EN 50128
FDA | IEC 62304
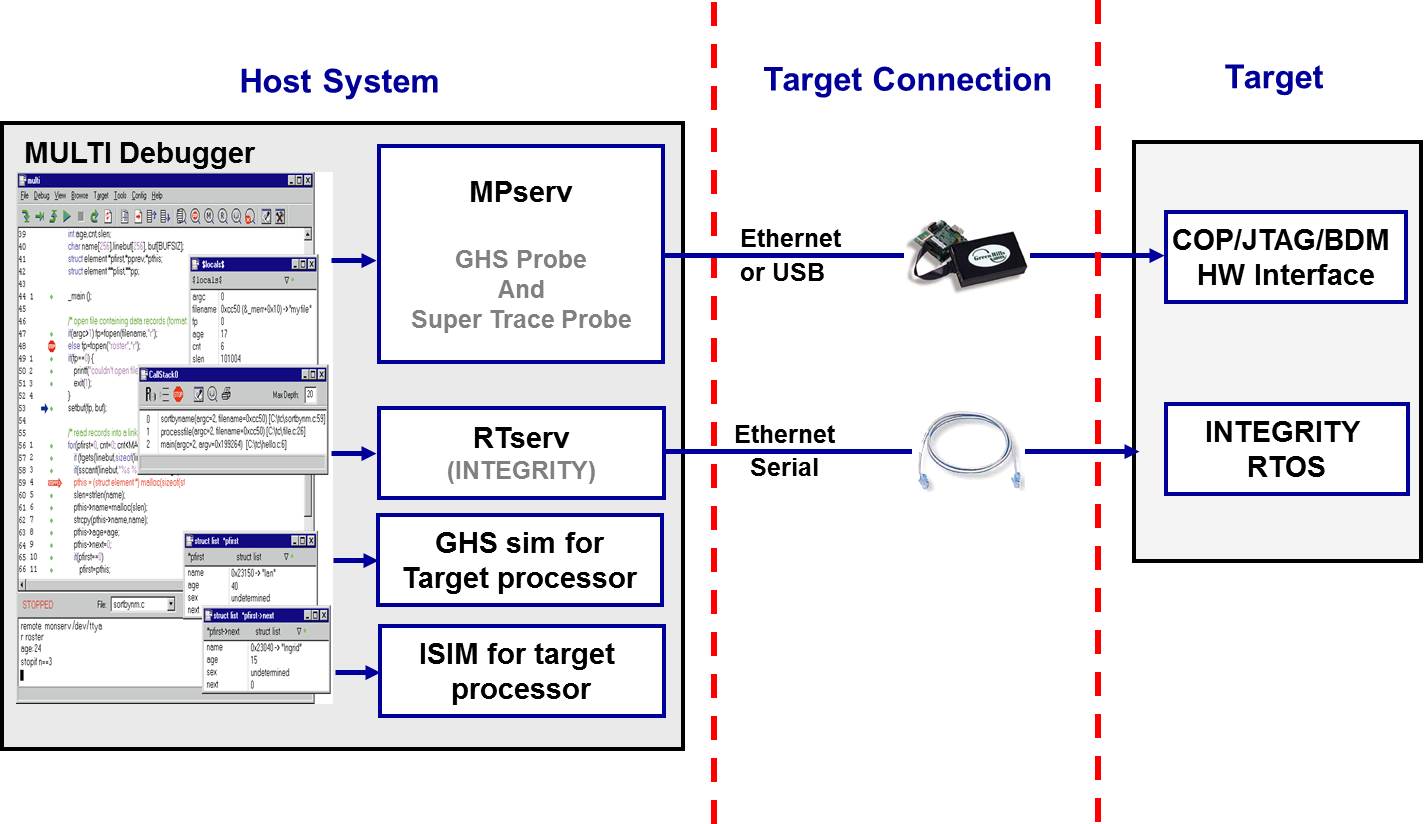
The Green Hills cross development environment has two fundamental components:
Multi, which includes the editor, compiler (C/C++ or Ada), linker, debugger, builder (automatic generation of object code), profiler, etc.
The GH Probe debugging probe (hardware device), which connects to the host via USB or Ethernet and to the target via the JTAG, COP, or BDM port.
Optionally, a Green Hills real-time operating system such as Integrity, VelOSity, or uVelOSity can be incorporated.
Green Hills develops its own C/C++ and Ada compilers.
These compilers stand out for their multiple optimization options and their applicability to project, file and even line-of-code level.
The result: according to the Embedded Microprocessor Benchmark Consortium (EEMBC- www.eembc.org), Green Hills compilers achieve the best scores in generating the fastest and smallest code.
In most programs, Green Hills compilers generate executables that are 20% faster than those generated with the GNU compiler.
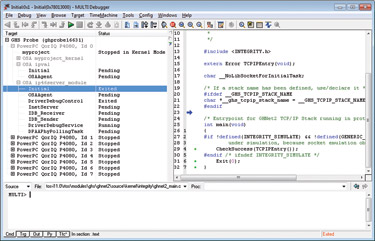
The Green Hills debugger clearly stands out for its performance in handling multiple tasks, cores, cards or any combination thereof.
Combined with the Integrity or uVelOSity operating systems, it allows visualizing any operating system object at the highest possible level of detail. It also allows visualizing any specific microcontroller register, including those for peripheral control.
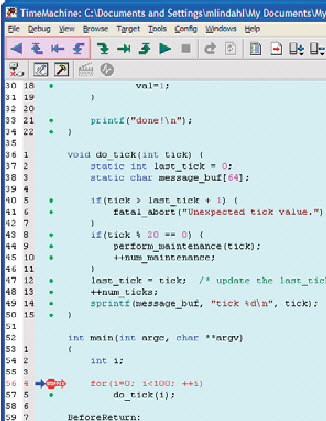
Multi Professional and the GH Probe allow debugging backwards in time, which is of vital importance in case of a break in program execution (core dumped). This functionality makes it possible to debug sporadic or random problems that are very difficult to correct otherwise.
This tool is very useful for detecting errors in complex environments where there are multiple tasks, multiple cores, multiple cards, or any combination thereof.
The Target List function displays these components hierarchically, making it easier to track the execution flow of the application from one context to another, seeing the interdependencies between the different tasks. Information on the status of all components is displayed, which facilitates a global view of the system status.
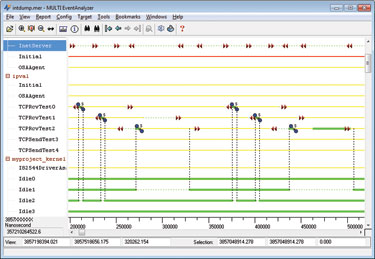
This tool shows the frequency and duration of Integrity operating system events over time.
It is very useful for detecting high-level performance problems such as incorrectly assigned task priorities, excessive interrupt service routine processing time, too many system calls, unexpected task context switches, etc.
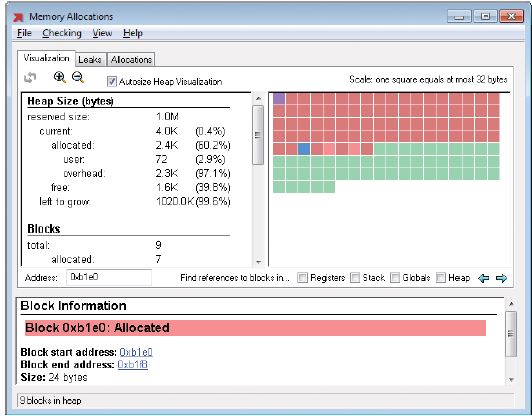
Multi Professional includes an integrated static code analyzer. This allows code analysis information to be obtained at the same time as a unit is being compiled, so the final analysis is much faster than with an external analyzer.
The static analyzer allows detecting certain errors before executing any code tests. Early error detection is critical to reduce the cost of error correction.
Supports hardware tracing, with 4 Gb of trace memory and a capture bandwidth of 40 Gb/sec.
Supports the latest high-speed serial trace (HSST) protocols, including multiple 12.5 Gb serial channels.
Supports sustained download speeds of 120MHz JTAG clock signal.
It can be reconfigured to debug software for different processor architectures: ARM, Power Architecture, Intel, etc.
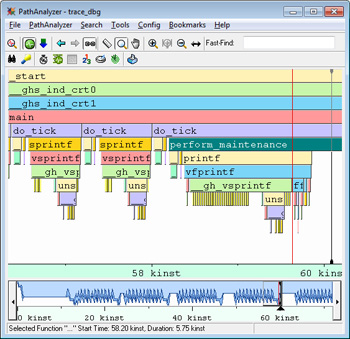
With Multi Professional you can execute, set breakpoints and view data backwards in time.
With Path Analyzer, included in Multi Professional, a graphical view of the different calls to the stack over time is provided.
| Cookie | Duration | Description |
|---|---|---|
| cookielawinfo-checkbox-analytics | 11 months | This cookie is set by GDPR Cookie Consent plugin. The cookie is used to store the user consent for the cookies in the category "Analytics". |
| cookielawinfo-checkbox-functional | 11 months | The cookie is set by GDPR cookie consent to record the user consent for the cookies in the category "Functional". |
| cookielawinfo-checkbox-necessary | 11 months | This cookie is set by GDPR Cookie Consent plugin. The cookies is used to store the user consent for the cookies in the category "Necessary". |
| cookielawinfo-checkbox-others | 11 months | This cookie is set by GDPR Cookie Consent plugin. The cookie is used to store the user consent for the cookies in the category "Other. |
| cookielawinfo-checkbox-performance | 11 months | This cookie is set by GDPR Cookie Consent plugin. The cookie is used to store the user consent for the cookies in the category "Performance". |
| viewed_cookie_policy | 11 months | The cookie is set by the GDPR Cookie Consent plugin and is used to store whether or not user has consented to the use of cookies. It does not store any personal data. |