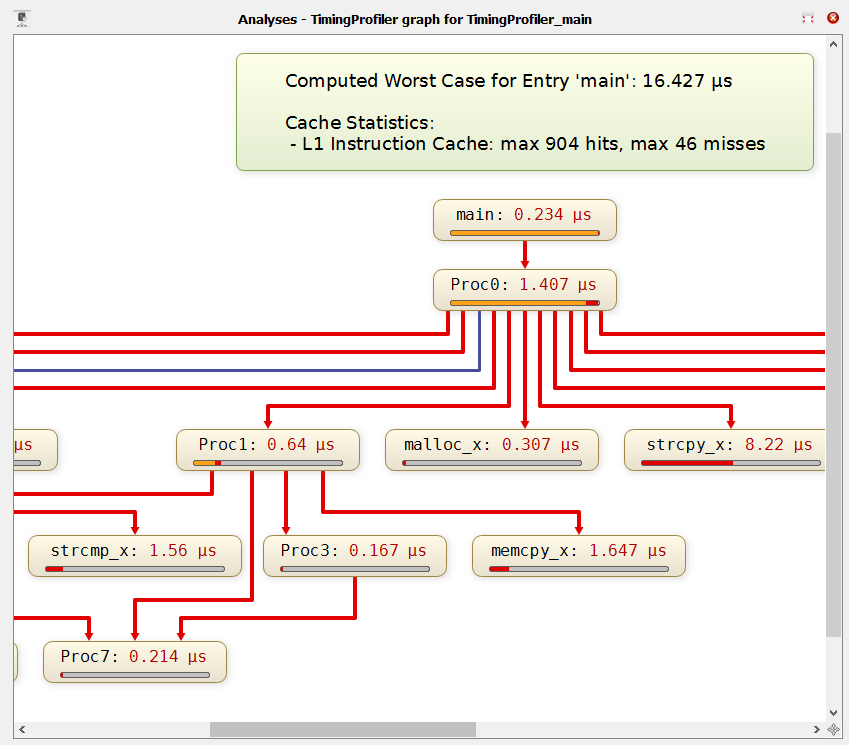
This tool allows obtaining an approximate WCET during the initial phases of software development exclusively through static analysis of the binary code.
It is based on the exploration of all possible execution paths of a task or program and on an approximate calculation of the instruction execution times for that processor architecture.
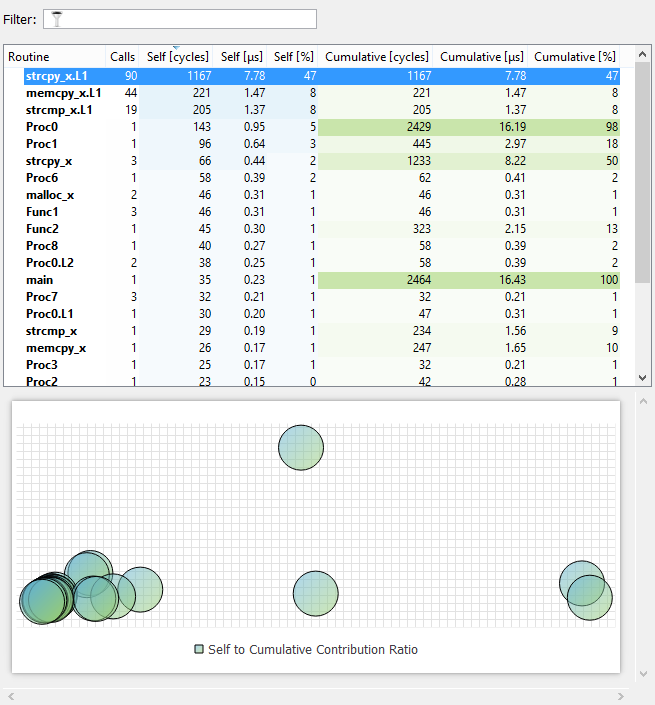
The margin of error in the WCET calculation is too large to be considered as evidence of certification of this objective, but it allows determining at the beginning the critical execution points and bottlenecks in terms of task-level performance.
This allows monitoring the execution times as the source code is developed, avoiding last-minute problems when the formal WCET calculation is done.
It also allows visualizing function call and flow control graphs. With the ValueAnalyzer plug-in, it also allows monitoring the use of variables (reads and writes).
All this functionality is provided without the need to have the development board, or perform any instrumentation of the code.
Nor is it necessary to perform a complex configuration. It is very easy to use from the beginning of development and can be integrated into continuous integration environments, being able to obtain performance measurements in each build of any part of the source code.